• About
  • FAQ
  • Earn Bitcoin while Surfing the net
  • Buy & Sell Crypto on Paxful
Newsletter
Approx Foundation
  • Home
    • Home – Layout 1
  • Bitcoin
  • Ethereum
  • Regulation
  • Market
  • Blockchain
  • Business
  • Guide
  • Contact Us
No Result
View All Result
  • Home
    • Home – Layout 1
  • Bitcoin
  • Ethereum
  • Regulation
  • Market
  • Blockchain
  • Business
  • Guide
  • Contact Us
No Result
View All Result
Approx Foundation
No Result
View All Result
Home Bitcoin

Want To Predict Bitcoin Tops And Bottoms? ‘The Rainbow Chart’ Is For You

approx by approx
December 29, 2023
in Bitcoin
0
189
SHARES
1.5k
VIEWS
Share on FacebookShare on Twitter


The Bitcoin Rainbow Chart has emerged as a universally used analytics tool that helps crypto investors and traders predict BTC’s ever-changing market trends and cycles. 

Bitcoin Rainbow Chart BTC Analysis

Throughout the year, the price of Bitcoin has experienced several uptrends and downsides. Starting from the last three months of 2023, BTC’S price has experienced a major surge, hitting above $35,000 in October and surging past $44,000 in December. 

With the market moving up rapidly, many crypto investors and market watchers look for various crypto analytics tools to enhance their understanding of the Bitcoin market trends. 

The Bitcoin Rainbow Chart is one of the many analytics tools available for predicting the potential prices of BTC. This color-coded chart is a long-term valuation tool for BTC that uses a logarithmic growth curve to forecast the potential price of BTC. 

Bitcoin rainbow chart

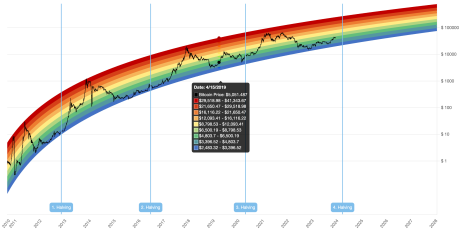
Source: Blockchain Center

Currently, according to the rainbow chart, Bitcoin is positioned around the “Accumulate” and “Still cheap” zones. This implies that the chart is showing the best timeline to purchase BTC before the selling phase begins. 

The Bitcoin Rainbow Chart simplifies BTC price predictions, helping investors identify potential BTC buying and selling opportunities. However, it’s important to note that the Bitcoin Rainbow Chart is not investment advice and does not predict the exact price of Bitcoin. 

Bitcoin price chart from Tradingview.com (The Rainbow Chart)

BTC price readies to retest $43,000 | Source: BTCUSD On Tradingview.com

History Of The BTC Rainbow Chart

The Bitcoin Rainbow Chart first started as a fun project created by a Reddit user, Azop to visually represent Bitcoin’s price history. However, the chart became more mainstream after a second version was developed by trader Trololo and transformed into a crypto technical analysis tool. 

The chart is designed using a color coding scheme and highlights each Bitcoin halving cycle and diverse BTC price ranges. With its seven color bands, the rainbow chart identifies strategic points to buy, sell, or hold BTC. 

The dark red band signals a maximum bubble territory, the red band indicates a robust selling phase, while orange and yellow signify FOMO intensification and HODL periods respectively. The Green band indicates a favorable buying and accumulation window and lastly, the blue color band represents a fire sale opportunity. 

While the Bitcoin Rainbow Chart does not provide financial advice, it is a widely recognized tool used by crypto traders and investors to gain a simpler understanding of BTC market movements. Ultimately, the accuracy of the chart’s predictions depends on how it is applied and in what context. 

Featured image from Crypto.com, chart from Tradingview.com

Disclaimer: The article is provided for educational purposes only. It does not represent the opinions of NewsBTC on whether to buy, sell or hold any investments and naturally investing carries risks. You are advised to conduct your own research before making any investment decisions. Use information provided on this website entirely at your own risk.


Source link

Related articles

XRP/BTC Retests 6-Year Breakout Trendline, Analyst Calls For Decoupling

XRP/BTC Retests 6-Year Breakout Trendline, Analyst Calls For Decoupling

October 26, 2025
Why The Bitcoin Price May Be Decoupling From Its Four-Year Cycle

Why The Bitcoin Price May Be Decoupling From Its Four-Year Cycle

October 26, 2025
Share76Tweet47

Related Posts

XRP/BTC Retests 6-Year Breakout Trendline, Analyst Calls For Decoupling

XRP/BTC Retests 6-Year Breakout Trendline, Analyst Calls For Decoupling

by Moussa
October 26, 2025
0

The XRP/BTC monthly chart has finally snapped the long diagonal that’s capped XRP since 2018, and one analyst on X...

Why The Bitcoin Price May Be Decoupling From Its Four-Year Cycle

Why The Bitcoin Price May Be Decoupling From Its Four-Year Cycle

by Moussa
October 26, 2025
0

Has the bitcoin price finally broken away from its four-year cycle pattern, or is this bull market already entering exhaustion?...

Bitcoin Whale’s $300M Transfer Sparks Speculation After Kraken Hot Wallet Transaction Goes Viral

Bitcoin Whale’s $300M Transfer Sparks Speculation After Kraken Hot Wallet Transaction Goes Viral

by Moussa
October 26, 2025
0

On Sunday, X lit up with chatter about a mystery bitcoin whale quietly scooping up thousands of BTC from Kraken’s...

peer discovery – how to obtain the IP addresses of nodes for mining pools?

Exodus import from computer to computer

by Moussa
October 26, 2025
0

If data in the files are encrypted, you are supposed to read them by running the Exodus application and giving...

Tether Experts Record $15B Profit For 2025: Bloomberg

Tether Experts Record $15B Profit For 2025: Bloomberg

by Moussa
October 26, 2025
0

Join Our Telegram channel to stay up to date on breaking news coverage USDT stablecoin issuer Tether expects a record...

Load More

youssufi.com

sephina.com

[vc_row full_width="stretch_row" parallax="content-moving" vc_row_background="" background_repeat="no-repeat" background_position="center center" footer_scheme="dark" css=".vc_custom_1517813231908{padding-top: 60px !important;padding-bottom: 30px !important;background-color: #191818 !important;background-position: center;background-repeat: no-repeat !important;background-size: cover !important;}" footer_widget_title_color="#fcbf46" footer_button_bg="#fcb11e"][vc_column width="1/4"]

We bring you the latest in Crypto News

[/vc_column][vc_column width="1/4"][vc_wp_categories]
[/vc_column][vc_column width="1/4"][vc_wp_tagcloud taxonomy="post_tag"][/vc_column][vc_column width="1/4"]

Newsletter

[vc_raw_html]JTNDcCUzRSUzQ2RpdiUyMGNsYXNzJTNEJTIydG5wJTIwdG5wLXN1YnNjcmlwdGlvbiUyMiUzRSUwQSUzQ2Zvcm0lMjBtZXRob2QlM0QlMjJwb3N0JTIyJTIwYWN0aW9uJTNEJTIyaHR0cHMlM0ElMkYlMkZhcHByb3gub3JnJTJGJTNGbmElM0RzJTIyJTNFJTBBJTBBJTNDaW5wdXQlMjB0eXBlJTNEJTIyaGlkZGVuJTIyJTIwbmFtZSUzRCUyMm5sYW5nJTIyJTIwdmFsdWUlM0QlMjIlMjIlM0UlM0NkaXYlMjBjbGFzcyUzRCUyMnRucC1maWVsZCUyMHRucC1maWVsZC1maXJzdG5hbWUlMjIlM0UlM0NsYWJlbCUyMGZvciUzRCUyMnRucC0xJTIyJTNFRmlyc3QlMjBuYW1lJTIwb3IlMjBmdWxsJTIwbmFtZSUzQyUyRmxhYmVsJTNFJTBBJTNDaW5wdXQlMjBjbGFzcyUzRCUyMnRucC1uYW1lJTIyJTIwdHlwZSUzRCUyMnRleHQlMjIlMjBuYW1lJTNEJTIybm4lMjIlMjBpZCUzRCUyMnRucC0xJTIyJTIwdmFsdWUlM0QlMjIlMjIlM0UlM0MlMkZkaXYlM0UlMEElM0NkaXYlMjBjbGFzcyUzRCUyMnRucC1maWVsZCUyMHRucC1maWVsZC1lbWFpbCUyMiUzRSUzQ2xhYmVsJTIwZm9yJTNEJTIydG5wLTIlMjIlM0VFbWFpbCUzQyUyRmxhYmVsJTNFJTBBJTNDaW5wdXQlMjBjbGFzcyUzRCUyMnRucC1lbWFpbCUyMiUyMHR5cGUlM0QlMjJlbWFpbCUyMiUyMG5hbWUlM0QlMjJuZSUyMiUyMGlkJTNEJTIydG5wLTIlMjIlMjB2YWx1ZSUzRCUyMiUyMiUyMHJlcXVpcmVkJTNFJTNDJTJGZGl2JTNFJTBBJTNDZGl2JTIwY2xhc3MlM0QlMjJ0bnAtZmllbGQlMjB0bnAtcHJpdmFjeS1maWVsZCUyMiUzRSUzQ2xhYmVsJTNFJTNDaW5wdXQlMjB0eXBlJTNEJTIyY2hlY2tib3glMjIlMjBuYW1lJTNEJTIybnklMjIlMjByZXF1aXJlZCUyMGNsYXNzJTNEJTIydG5wLXByaXZhY3klMjIlM0UlQzIlQTBCeSUyMGNvbnRpbnVpbmclMkMlMjB5b3UlMjBhY2NlcHQlMjB0aGUlMjBwcml2YWN5JTIwcG9saWN5JTNDJTJGbGFiZWwlM0UlM0MlMkZkaXYlM0UlM0NkaXYlMjBjbGFzcyUzRCUyMnRucC1maWVsZCUyMHRucC1maWVsZC1idXR0b24lMjIlM0UlM0NpbnB1dCUyMGNsYXNzJTNEJTIydG5wLXN1Ym1pdCUyMiUyMHR5cGUlM0QlMjJzdWJtaXQlMjIlMjB2YWx1ZSUzRCUyMlN1YnNjcmliZSUyMiUyMCUzRSUwQSUzQyUyRmRpdiUzRSUwQSUzQyUyRmZvcm0lM0UlMEElM0MlMkZkaXYlM0UlM0NiciUyRiUzRSUzQyUyRnAlM0U=[/vc_raw_html][/vc_column][/vc_row]
No Result
View All Result
  • Contact Us
  • Homepages
  • Business
  • Guide

© 2024 APPROX FOUNDATION - The Crypto Currency News