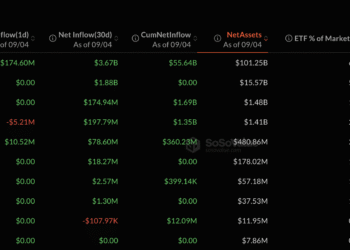




U.S. spot Bitcoin ETFs have pulled in $3.8 billion in net inflows over a three-week stretch, with BlackRock’s IBIT and Fidelity’s FBTC leading the flow data.
The figure gives Bitcoin traders another strong institutional-demand signal after a volatile period for broader risk assets. ETF flows are not the whole Bitcoin market, but they remain one of the cleanest windows into regulated investor appetite.
The Labor Day slowdown also needs context.
Daily inflows eased heading into the holiday break, but that does not automatically mean institutions are leaving. Holiday liquidity can distort daily activity, especially around U.S. market closures. The broader three-week figure is the more meaningful data point.
For more details, visit the official Farside platform.
TL;DR
- U.S. spot Bitcoin ETFs recorded $3.8 billion in net inflows over three weeks.
- BlackRock’s IBIT and Fidelity’s FBTC led the allocations.
- The Labor Day slowdown should not be treated as institutional exit.
Why Three-Week ETF Flows Matter
Bitcoin ETF flows have become part of the market’s daily language.
When the funds bring in capital, traders often treat it as confirmation that traditional investors are still adding exposure. When they see outflows, the mood can turn quickly.
A three-week inflow stretch is more useful than a single daily print.
Daily flows can be noisy. They can reflect rebalancing, timing, basis trades, or one fund’s movement. A multi-week total shows a more sustained pattern of demand across the ETF channel.
That is why $3.8 billion matters.
It suggests that regulated Bitcoin exposure remains attractive, even as the market moves through macro uncertainty, holiday disruptions, and shifting liquidity.
IBIT And FBTC Remain The Big Names
BlackRock’s IBIT and Fidelity’s FBTC have been two of the most closely watched spot Bitcoin ETF products since launch.
That is not surprising. Both firms have large distribution networks, strong institutional relationships, and brand recognition outside crypto. For advisers and allocators, the issuer name matters.
If those two products are leading inflows, the market reads it as more than retail speculation.
It suggests that capital is still moving through major traditional-finance channels into Bitcoin exposure.
ETF Inflows Are Not AUM
One distinction is important.
Net inflows are not the same as assets under management. Inflows show new capital moving into the funds during a measured period. AUM reflects the total value of assets held, which can change because of both flows and Bitcoin price movement.
Confusing the two can lead to sloppy analysis.
The $3.8 billion figure is about net capital moving into the ETF products over the period, not the total size of the ETF market.
Holiday Trading Can Distort The Tape
The September 4 slowdown came ahead of the U.S. Labor Day market closure.
That matters because holidays can reduce trading volume, delay allocation decisions, and thin market activity. Traders may reduce exposure ahead of a long weekend, but that does not always reflect a structural change in demand.
The correct read is cautious.
A holiday slowdown may be relevant, but it should not outweigh three weeks of strong inflows unless the trend turns negative afterward.
The Market Signal
Bitcoin ETF demand remains alive.
That is the simplest takeaway. A $3.8 billion three-week inflow stretch suggests that institutional and adviser-channel demand is still supporting the market.
The next thing to watch is whether flows continue after the holiday disruption clears.
If IBIT, FBTC, and other spot Bitcoin ETFs keep adding capital, the market will have a strong demand signal heading deeper into September. If flows weaken sharply, traders may start questioning whether the three-week run was a temporary burst.
For now, the ETF channel remains one of Bitcoin’s clearest bullish data points.
This article draws on U.S. spot Bitcoin ETF flow data from Farside Investors and SoSoValue.
This article was written by the News Desk and edited by Samuel Rae.