




Key Takeaways
- Bitcoin’s price bounced from $76,370 to $78,329, putting buyers back in control of the short-term chart.
- Market data shows 11 positive moving averages, but 9 neutral oscillators leave momentum undecided.
- Bitcoin’s price needs to reach $79,000-$80,000 next; losing $76,000 could expose the lower-$74,000s.
Bitcoin spent the latest session doing a pretty convincing impression of a market that couldn’t make up its mind. The price dropped to $76,370, buyers jumped all over it, and within hours, bitcoin was knocking on $78,329 before settling near $77,800. That leaves the market in an interesting spot. The bounce was real, but so is the resistance sitting immediately overhead. Bitcoin’s price has repeatedly found buyers around the mid-$76,000s, yet every attempt to escape the larger $76,000-$82,000 range has eventually run out of steam. For now, the bulls have the ball. They just haven’t carried it very far.
The 1-Hour Chart Just Pulled off a Pretty Sharp Reversal
On the 1-hour chart, bitcoin’s latest price move looks like a classic V-shaped recovery. Sellers pushed the price down to $76,370 before buyers came out swinging, driving it as high as $78,329. The market has since backed away toward $77,800, but it hasn’t surrendered much of the rebound. That keeps the short-term structure constructive, especially after the sequence of higher lows and higher highs that followed the session bottom.
The interesting area now sits around $77,400-$77,700. As long as bitcoin can keep its footing there, buyers still have a reasonable launching pad for another crack at $78,300-$78,400. Breaking that ceiling would change the tone fairly quickly and put $79,000-$79,500 within reach. That sounds simple enough, but the market has been struggling with exactly this kind of overhead resistance for weeks.
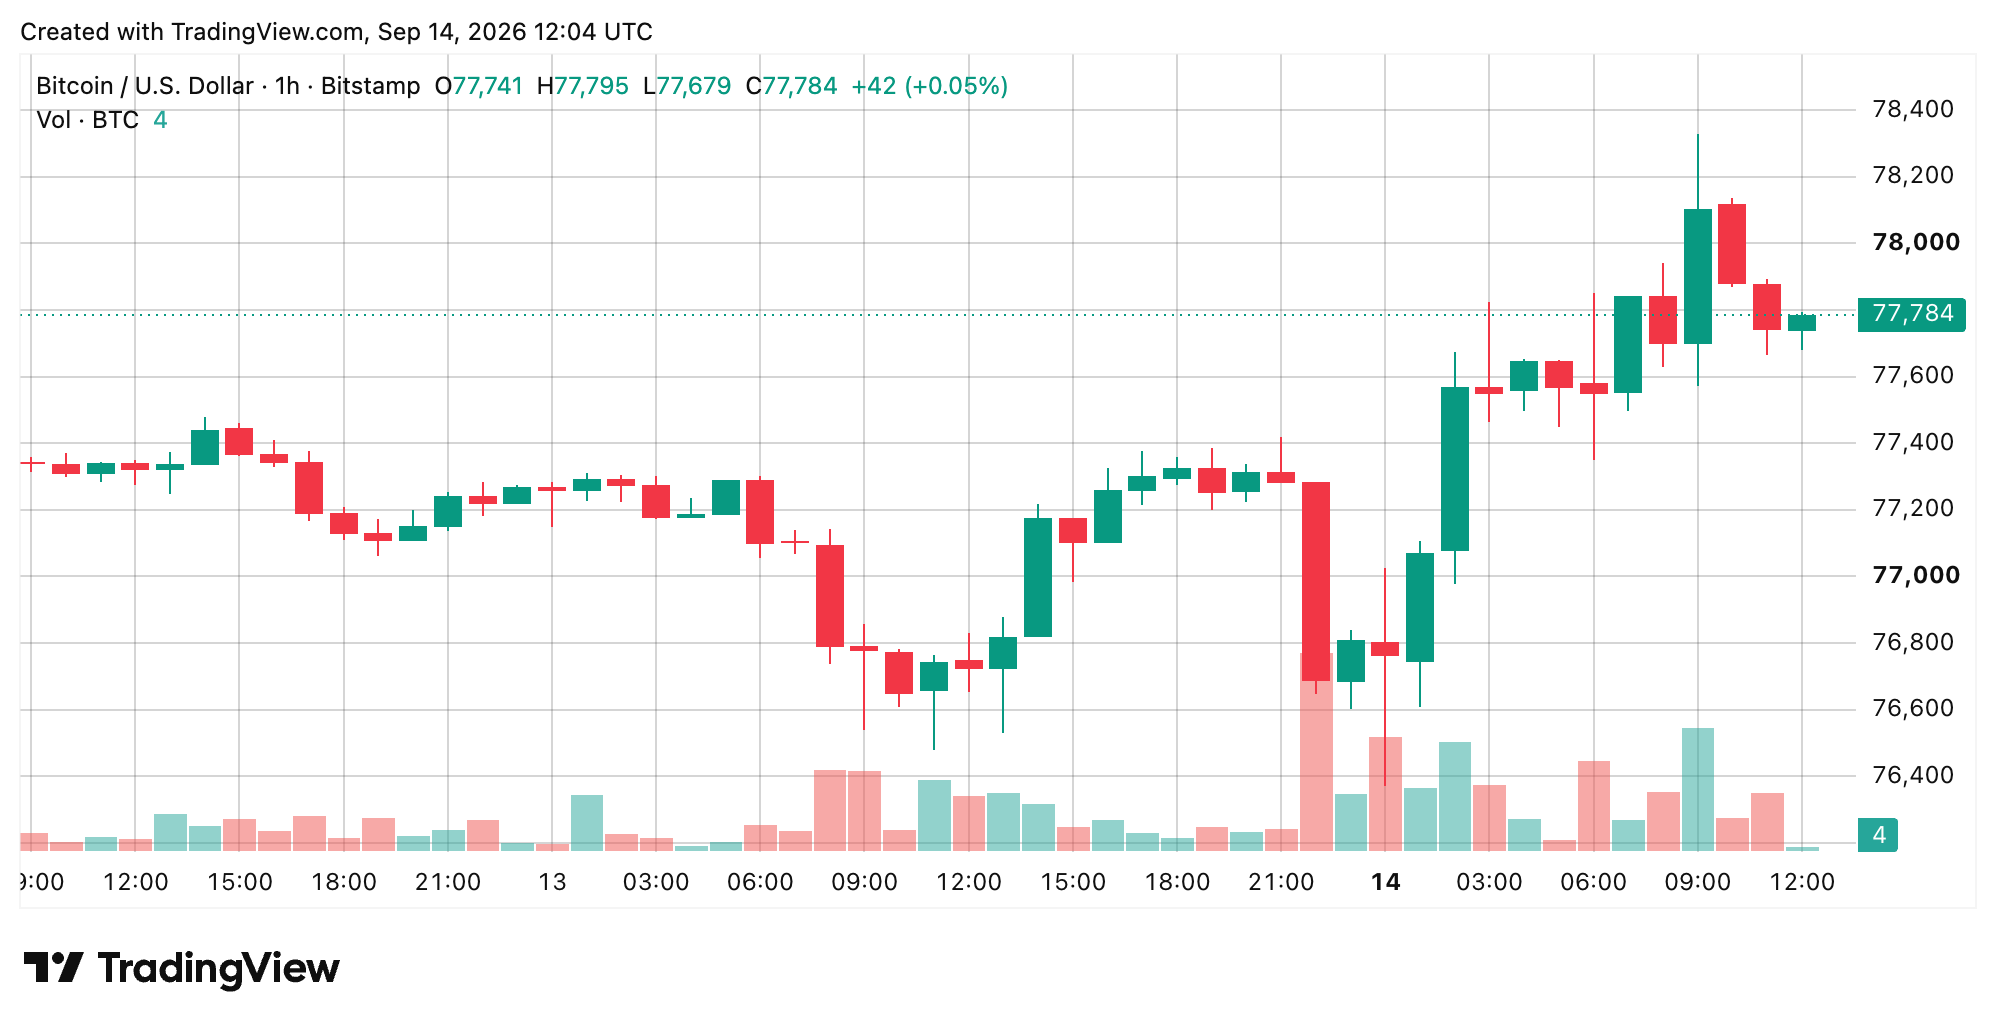
On the flip side, a drop through roughly $77,000 would take some of the shine off the rebound. Below there, $76,370 comes right back into focus. That level matters because it isn’t theoretical support drawn from some obscure indicator. Buyers actually defended it during this session. If bitcoin closes an hourly candle beneath it, the V-shaped recovery starts looking considerably less impressive.
The 4-Hour Chart Has a Bigger Wall Waiting Upstairs
Zooming out to the 4-hour chart makes the recovery look encouraging, but it also makes the problem easier to see. Bitcoin’s price range has spent several sessions grinding around the lower end of its recent range after sliding from the low-$82,000s. Buyers have now dragged the price back toward the upper portion of that short-term structure, leaving $78,300-$79,000 as the next serious test.
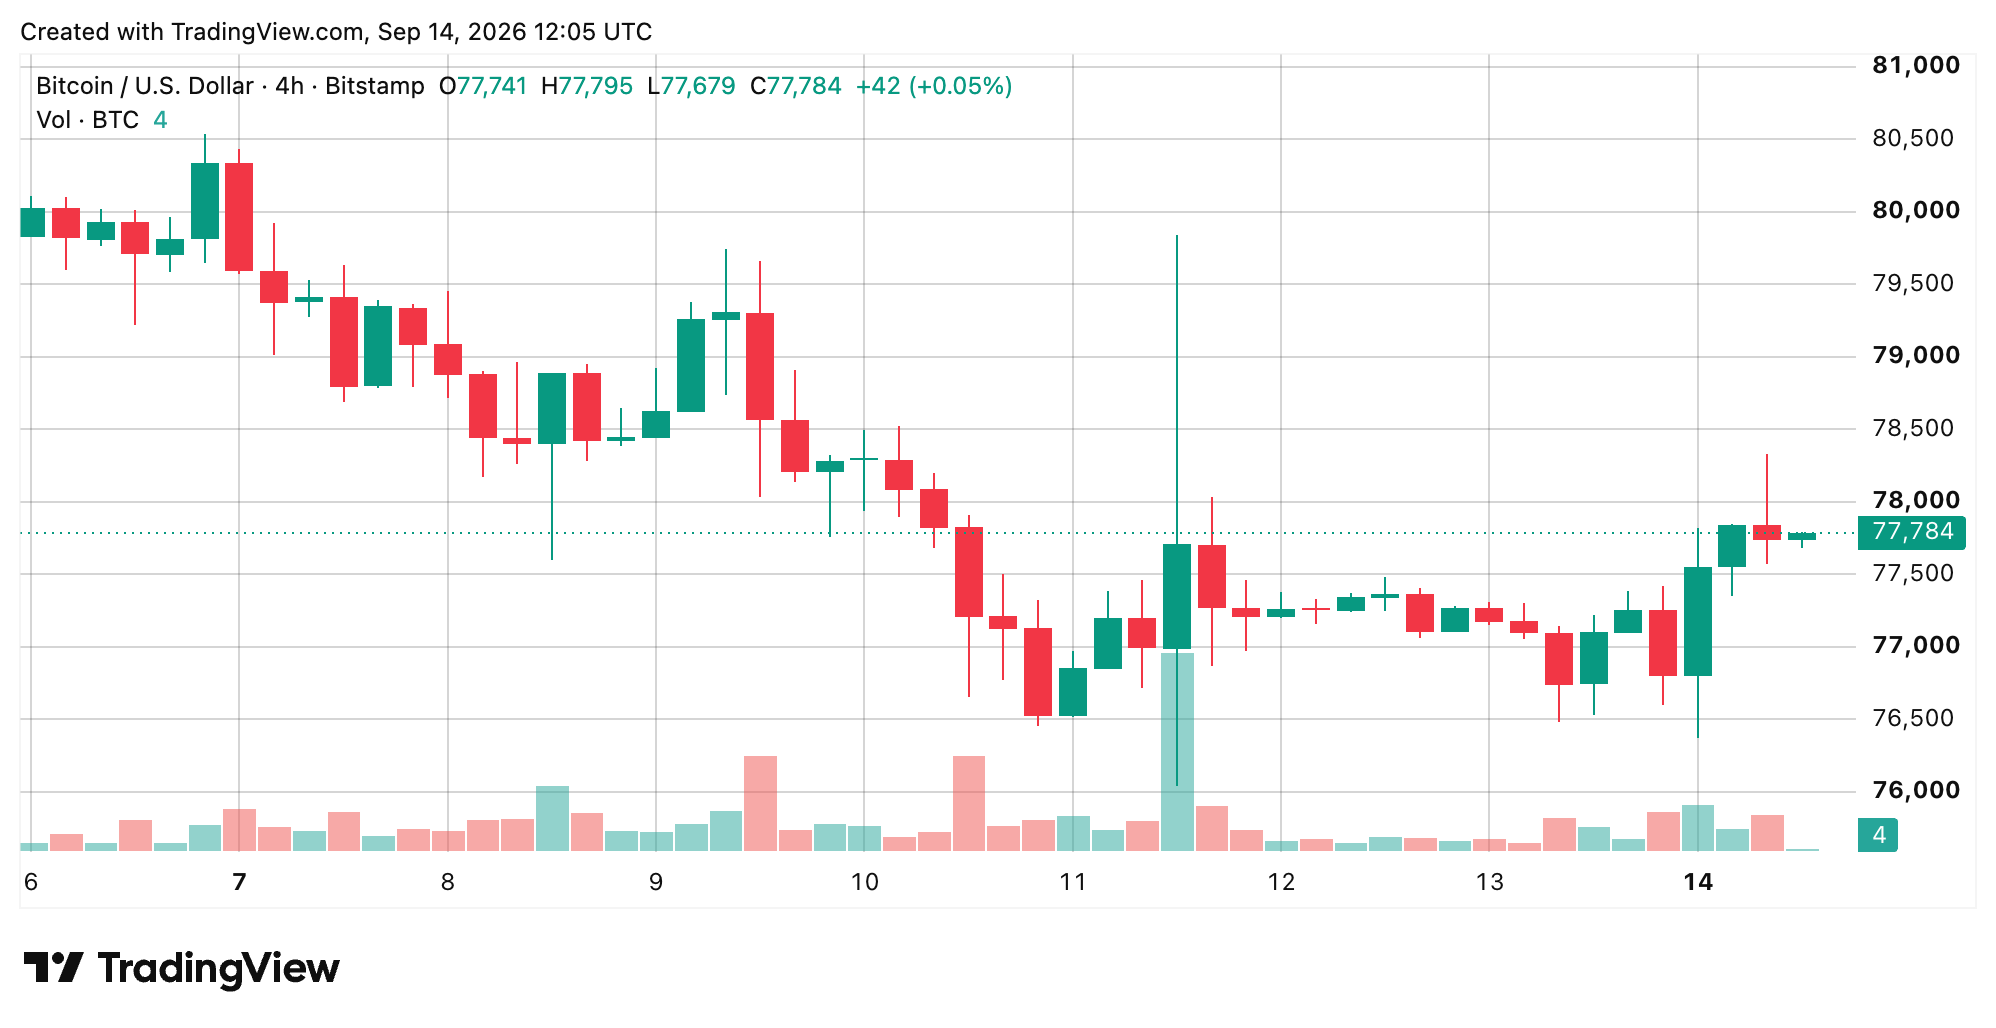
Get through there, and things get more interesting. A convincing 4-hour close above $79,000 would put the Sept. 11 wick near $79,837 directly in the crosshairs, making roughly $79,800-$80,000 the first obvious area where traders could start taking money off the table. Beyond $80,000, bitcoin would finally have some breathing room to challenge the larger highs again.
But rejection here would keep the market stuck in the same frustrating loop. Bitcoin could revisit $77,000, followed by the much stronger $76,000-$76,500 area that has repeatedly attracted buyers. Put another way, bitcoin is walking a tightrope between a floor that keeps holding and a ceiling it still hasn’t broken.
The Daily Chart Tells a Completely Different Story
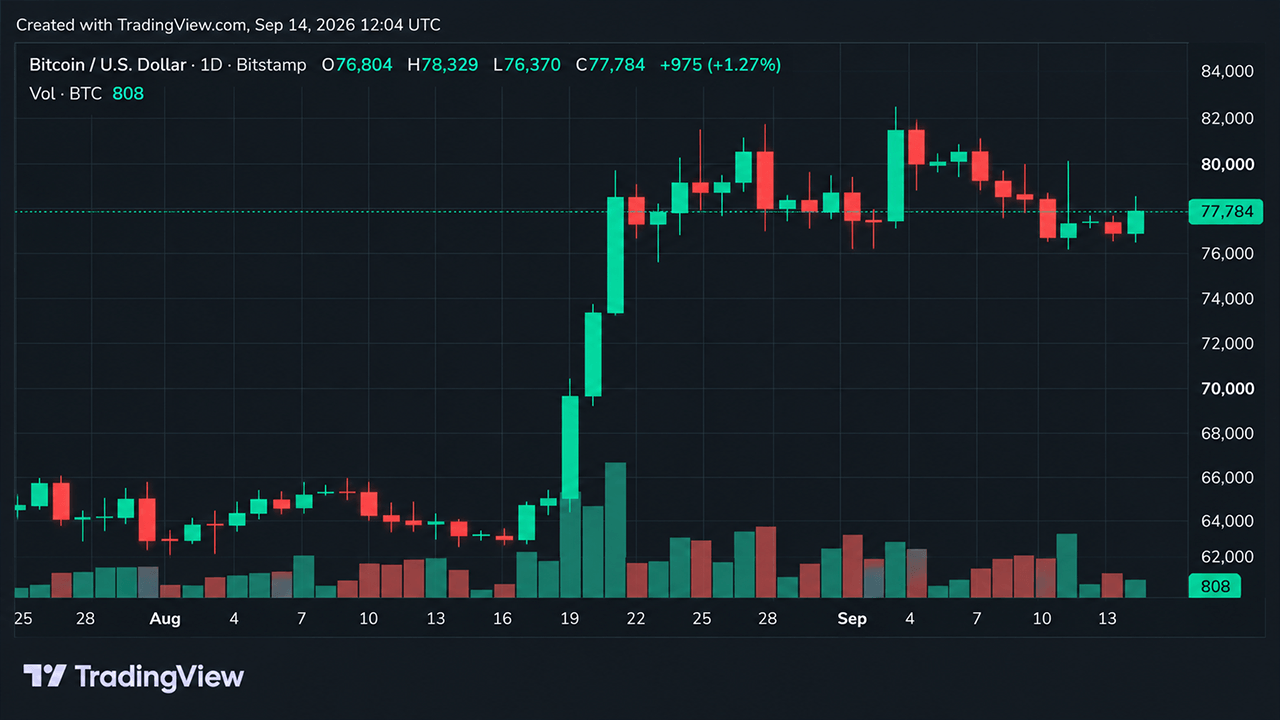
The daily chart is where all that short-term excitement starts looking a little smaller. Bitcoin previously ran from $62,470 to $82,281, an advance of nearly $20,000, but it has since spent weeks chopping around between roughly $76,000 and $82,000. The recent pullback has also produced lower highs, meaning the larger chart still looks more like consolidation than a market ready to bolt.
That makes $80,000 particularly important. Bulls need to reclaim that psychological level and eventually $82,281-$82,833 before they can convincingly say they’re back in the driver’s seat. Until then, every short-term rally is happening beneath the same ceiling that stopped the previous advance.
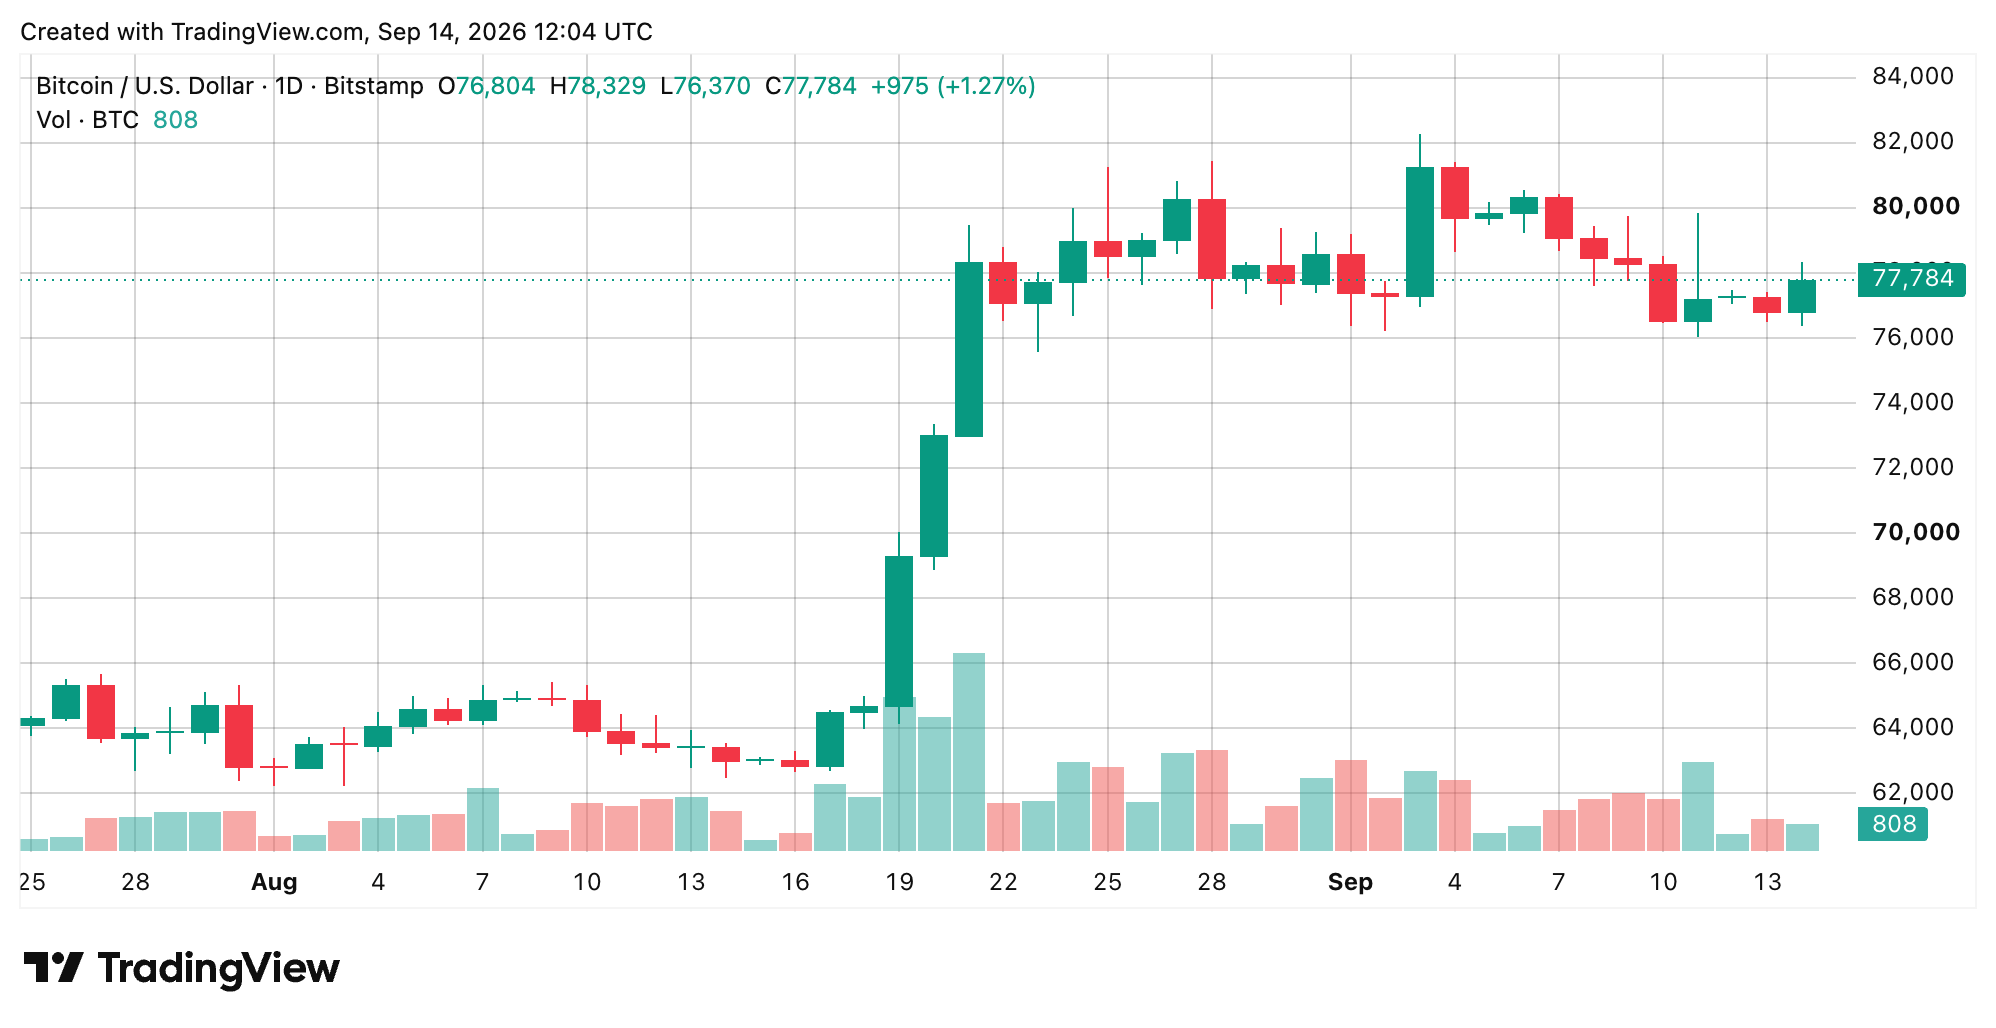
Still, sellers have their own problems. Repeated attempts to push bitcoin materially beneath $76,000 haven’t stuck. The latest session offered another example, with the price falling into the mid-$76,000s and getting snapped back toward $78,000. So while buyers haven’t broken the ceiling, sellers haven’t exactly kicked the floor out either. That leaves bitcoin boxed into a range where both sides can point to evidence that they’re winning.
The Oscillators Are Basically Refusing to Pick a Side
The daily oscillator tape is almost comically undecided. The relative strength index (RSI) sits at 57, comfortably away from an overheated reading, while Stochastic is down at 20, and Stochastic RSI fast sits at just 11.
The commodity channel index (CCI), average directional index (ADX), Awesome oscillator (AO), Williams, Ultimate oscillator (UO) and bull bear power are all neutral. Momentum is the lone positive reading, while MACD is the only negative one. Altogether, oscillators count nine neutral signals, one positive, and one negative via the 24-hour timeframe. In other words, the current readings are essentially saying: ask again later.
The Moving Averages Are Much Less Shy
The moving averages (MAs) tell a much more optimistic story, with 11 positive readings against only three negative ones. Bitcoin is sitting almost directly on the 10-day exponential moving average (EMA) at $77,757, while the 20-day EMA at $77,079 remains underneath the market. The trouble is clustered immediately overhead.
The 10-day simple moving average (SMA) at $78,157, 20-day SMA at $78,443 and volume-weighted moving average near $78,504 are all negative readings, creating a pretty obvious traffic jam above the current price. Get through that cluster and the picture changes considerably. Below it, the 30-, 50-, 100- and 200-day averages remain positive, suggesting the larger structure has plenty of support underneath.
Bull Verdict:
Bitcoin’s rebound from $76,370 has some teeth, and the longer moving averages still favor buyers. A clean break through $78,500 followed by $79,000 would put $80,000 back on the table and could reopen the road toward $82,281-$82,833.
Bear Verdict:
The rebound hasn’t actually escaped the range yet. Rejection around $78,300-$79,000 followed by a loss of $77,000 would put $76,370 back in play, while a decisive break beneath $76,000 could expose the lower-$74,000s.