
Bitcoin’s price cycles have long been a source of intrigue for investors and analysts alike. We can gain insights into potential price movements by comparing current trends to previous cycles, especially with Bitcoin seemingly coming to an end of its consolidation period, many wonder if the next leg up is around the corner.


Comparing Bitcoin Cycles
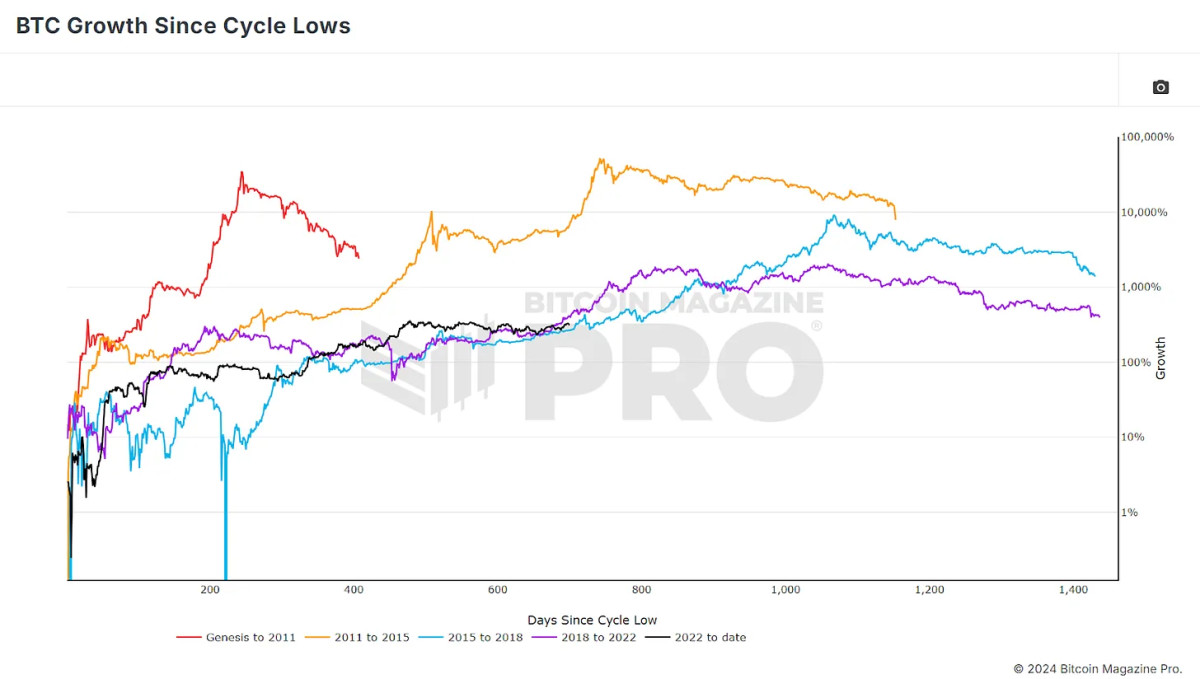
To begin, it’s crucial to look at how Bitcoin has performed since hitting its recent cycle low. As we examine the data, a clear picture begins to form: Bitcoin’s current price action (black line) is showing patterns similar to previous bull cycles. Although it has been a choppy consolidation period, where the price has been relatively stagnant, there are key similarities when we compare this cycle to those in 2015-2018 (purple line) and 2018-2022 (blue line).


Where we are today, in terms of percentage gains, is comparable to both the 2018 and 2015 cycles. However, this comparison only scratches the surface. Price action alone doesn’t tell the full story, so we need to dive deeper into investor behavior and other metrics that shape the Bitcoin market.
Investor Behavior
One key metric that gives us insight into investor behavior is the MVRV Z-Score. This ratio compares Bitcoin’s current market price to its “realized price” (or cost basis), which represents the average price at which all Bitcoin on the network was accumulated. The Z-Score then just standardizes the raw MVRV data for BTC volatility to exclude extreme outliers.

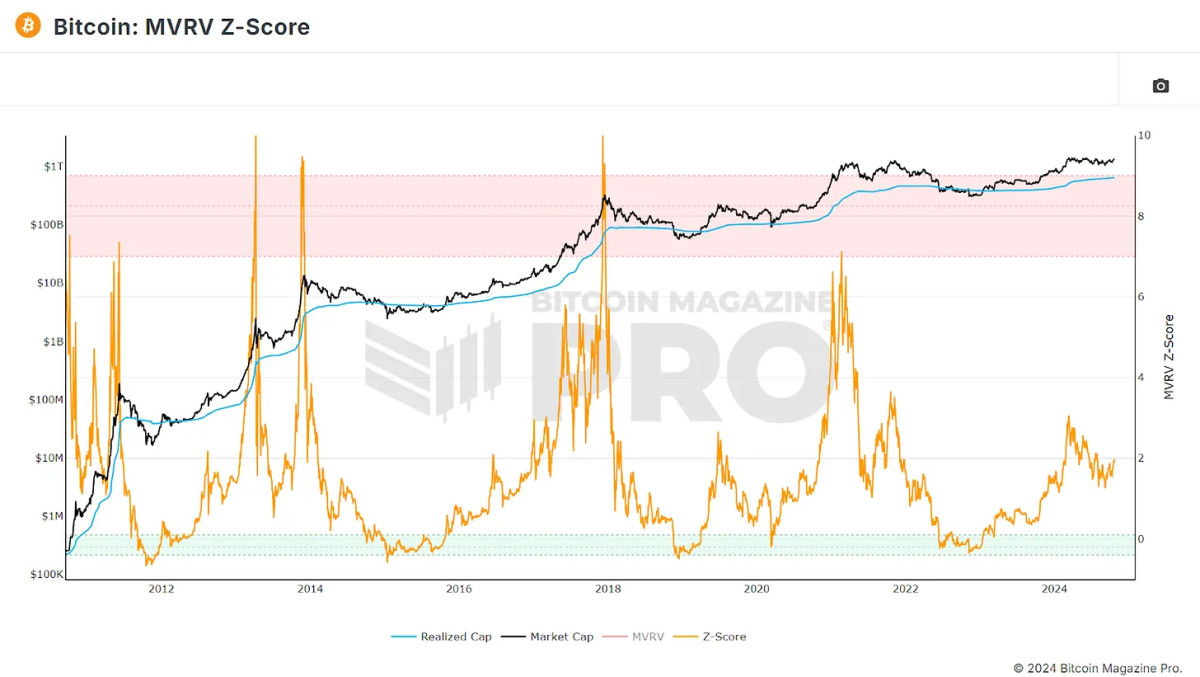
Analyzing metrics such as this one, as opposed to purely focusing on price actions, will allow us to see patterns and similarities in our current cycle to previous ones, not just in dollar movements but also in investor habits and sentiment.


Correlating Movements
To better understand how the current cycle aligns with previous ones, we turn to the data from Bitcoin Magazine Pro, which offers in-depth insights through its API. Excluding our Genesis cycle, as there is little correlation and isolating the price and MVRV data from Bitcoin’s lowest closing prices to its highest points in our current and previous three cycles, we can see clear correlations.
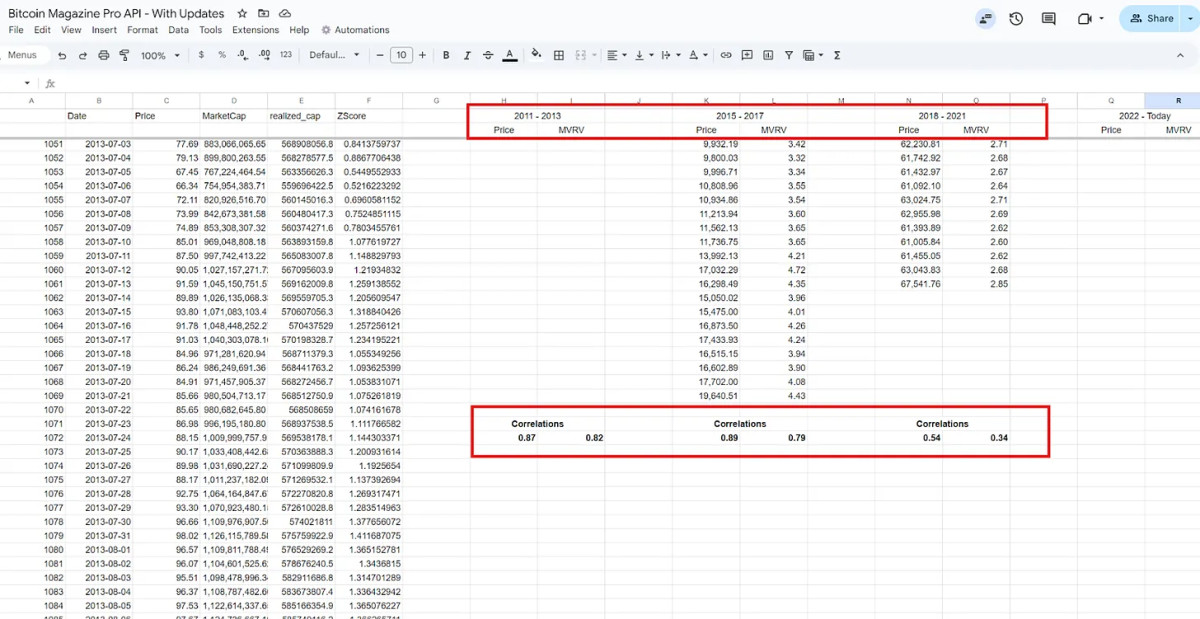
2011 to 2013 Cycle: This cycle, characterized by its double peak, shows a strong 87% correlation with the current price action. The MVRV ratio also shows a high 82% correlation, meaning that not only is Bitcoin’s price behaving similarly, but so is investor behavior in terms of buying and selling.
2015 to 2017 Cycle: This cycle is actually the closest in terms of price action, boasting an 89% correlation with our current cycle. However, the MVRV ratio is slightly lower, suggesting that while prices are following similar paths, investor behavior might be slightly different.
2018 to 2021 Cycle: This most recent cycle, while positive, has the lowest correlation to current trends, indicating that the market may not be following the same patterns it did just a few years ago.
Are We in for Another Double Peak?
The strong correlation with the 2011-2013 cycle is particularly noteworthy. During that period, Bitcoin experienced a double peak, where the price surged to new all-time highs twice before entering a prolonged bear market. If Bitcoin follows this pattern, we could be on the verge of significant price movements in the coming weeks. After overlaying the price action fractal from this period over our current cycle and standardizing the returns, the similarities are instantly noticeable.
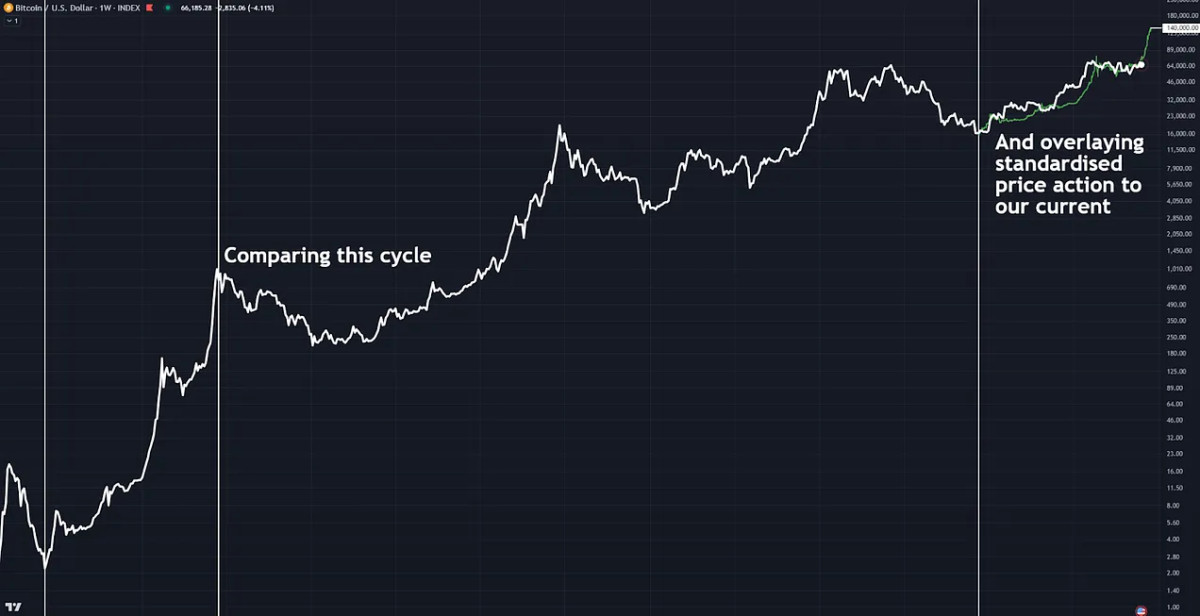
In both cases, Bitcoin had a rapid run-up to a new high, followed by a long, choppy period of consolidation. If history repeats itself, we could see a massive price rally soon, potentially to around $140,000 before the end of the year when accounting for diminishing returns.
Patterns In Investor Behavior
Another valuable metric to examine is the Value Days Destroyed (VDD). This metric weights BTC movements by the amount being moved and the time since it was last transferred and multiplies this value by the price to offer insights into long-term investors’ behavior, specifically profit-taking.
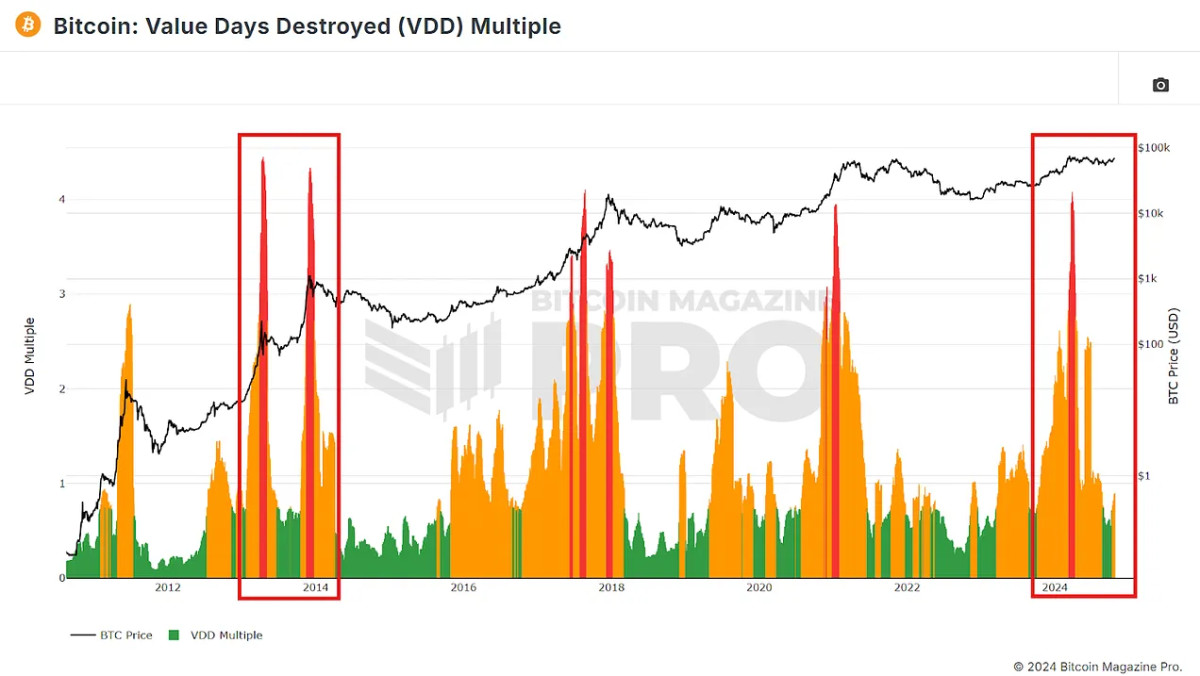
In the current cycle, VDD has shown an initial spike similar to the red spikes we saw during the 2013 double peak. This run-up as BTC ran to a new all-time high earlier this year before a sustained consolidation period could see us reaching new highs soon again if this double peak cycle pattern continues.

A More Realistic Scenario
As Bitcoin has grown and matured as an asset, we’ve seen extended cycles and diminishing returns in our two most recent cycles compared to our initial two. Therefore, it’s probably more likely that BTC follows the cycle in which we’re seeing the strongest correlation in price action.
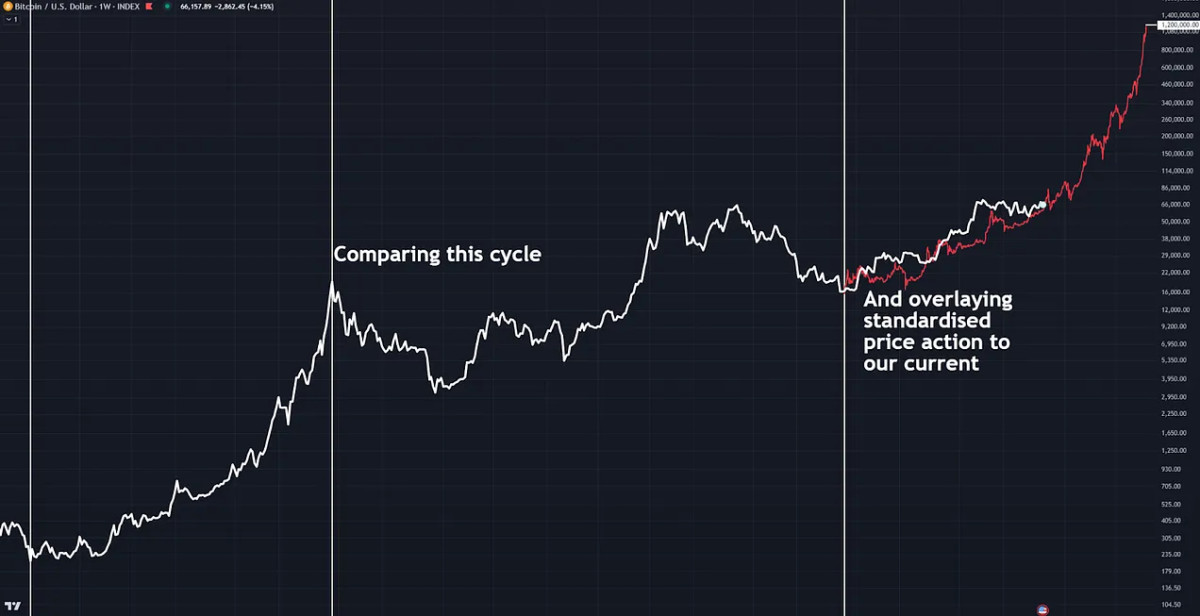
Figure 6: Overlaying a fractal of the 2017 cycle on our current price action.
If Bitcoin follows the 2015-2017 pattern, we could still see new all-time highs before the end of 2024, but the rally would likely be slower and more sustainable. This scenario predicts a price target of around $90,000 to $100,000 by early 2025. After that, we could see continuous growth throughout the year, with a potential market peak in late 2025, although a peak of $1.2 million if we follow this pattern exactly may be optimistic!
Conclusion
Historical data suggests we’re approaching a critical turning point. Whether we follow the explosive double-peak cycle from 2011-2013 or the slower but steady rise of 2015-2017, the outlook for Bitcoin remains bullish. Monitoring key metrics like the MVRV ratio and Value Days Destroyed will provide further clues as to where the market is headed, and comparing correlations with our previous cycles will give us better insights into what may be coming.
With Bitcoin poised for a breakout, whether in the next few weeks or in 2025, if BTC even remotely follows the patterns of any of our previous cycles, investors should prepare for significant price action and potential new all-time highs sooner rather than later.
For a more in-depth look into this topic, check out a recent YouTube video here: Comparing Bitcoin Bull Runs: Which Cycle Are We Following