



• About
  • FAQ
  • Earn Bitcoin while Surfing the net
  • Buy & Sell Crypto on Paxful
Newsletter
Approx Foundation
  • Home
    • Home – Layout 1
  • Bitcoin
  • Ethereum
  • Regulation
  • Market
  • Blockchain
  • Business
  • Guide
  • Contact Us
No Result
View All Result
  • Home
    • Home – Layout 1
  • Bitcoin
  • Ethereum
  • Regulation
  • Market
  • Blockchain
  • Business
  • Guide
  • Contact Us
No Result
View All Result
Approx Foundation
No Result
View All Result
Home Bitcoin

Ethereum Network Activity Reveals Structural Weakness Beneath The Surface – Analyst Explains

Moussa by Moussa
May 29, 2026
in Bitcoin
0
Ethereum Network Activity Reveals Structural Weakness Beneath The Surface – Analyst Explains
189
SHARES
1.5k
VIEWS
Share on FacebookShare on Twitter


Trusted Editorial content, reviewed by leading industry experts and seasoned editors. Ad Disclosure

Ethereum has lost the $2,000 level as support, a development that marks a significant deterioration in the recovery that had been building since the February lows. The breach of that psychological threshold has sharpened concern across the market — and a CryptoQuant analyst has identified a development in the on-chain data that adds a layer of structural context to the current weakness that goes beyond the price action itself.


Related articles

Shiba Inu Traders Withdraw 204 Billion SHIB Amid Sharp Drop In Futures Activity

Shiba Inu Traders Withdraw 204 Billion SHIB Amid Sharp Drop In Futures Activity

May 29, 2026
Bitcoin Miners Face AI Squeeze As Hash Rate Flattens And Network Enters New Security Phase, Fidelity Says

Bitcoin Miners Face AI Squeeze As Hash Rate Flattens And Network Enters New Security Phase, Fidelity Says

May 29, 2026

The signal the analyst has identified is not one that typically appears in mainstream market commentary — but its implications for Ethereum’s short-term supply dynamics are direct and measurable. Recent on-chain data suggests that Ethereum’s failed transaction count may be experiencing an upward trend. At the same time, exchange inflows appear to be showing a slight but gradual increase alongside that trend.

Failed transactions on a blockchain network are not simply technical errors. They represent attempted activity that the network processed without completing, and their frequency carries information about the nature of demand currently interacting with the Ethereum network. When failed transaction counts rise in a specific context, they can reflect a market under stress, with participants attempting to execute transactions at speeds or gas levels that the network’s current conditions are not accommodating.

The combination of rising failed transactions and increasing exchange inflows is the pairing the CryptoQuant analyst has flagged as worth examining — because together, they may be describing a market dynamic that the price chart is only beginning to reflect.

 Rising Exchange Inflows And A Price Without Direction

The CryptoQuant analyst connects the three data points into a coherent near-term assessment that each indicator alone would not fully support. Ethereum’s price is consolidating in primarily sideways movement — not collapsing aggressively, but equally not demonstrating the directional momentum that would suggest the $2,000 support breach was a temporary overextension rather than a structural shift.

Ethereum price with Exchange Inflow and failed transaction count | Source: CryptoQuant

Ethereum price with Exchange Inflow and failed transaction count | Source: CryptoQuant

Against that directionless price action, the rising failed transaction count describes network friction that reflects stress rather than organic activity growth. Failed transactions consuming gas without completing useful work is not the signature of a network experiencing healthy demand — it is the signature of a market where participants are competing for block space under conditions of uncertainty, rushing transactions at inappropriate gas levels, or attempting arbitrage and liquidation activity that speaks more to volatility management than genuine utility expansion.

The gradual increase in exchange inflows compounds the picture. Coins moving toward exchanges in a period of price weakness and network friction describes participants reducing their time horizon — moving from self-custody positions toward venues where assets can be sold quickly if conditions deteriorate further.

The analyst’s near-term assessment follows directly from the combination. No single element here confirms a bearish outcome independently — sideways price action can precede recovery as easily as decline, and moderate exchange inflows are not distributed at scale. But the convergence of network friction, increasing exchange-bound liquidity, and absent directional momentum creates a setup that the broader Ethereum landscape currently does little to offset. Until failed transaction trends reverse and exchange inflows stabilize, the data supports a cautious near-term outlook rather than one that anticipates an imminent recovery above $2,000.

Ethereum Loses Critical Support As Market Structure Weakens

Ethereum has broken below the psychological $2,000 level, confirming a significant deterioration in the recovery structure that had been developing since the February lows. The daily chart shows ETH failing to hold the key support cluster around $2,050–$2,100, an area that previously acted as the foundation for the April and early May rebound.
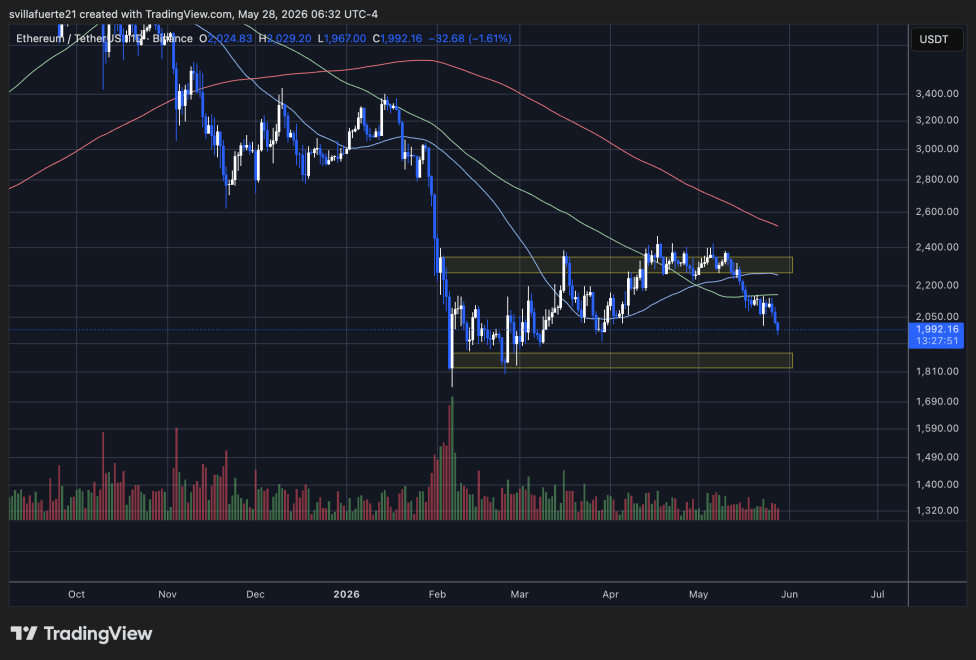
Ethereum losing momentum below $2,000 | Source: ETHUSDT chart on TradingView

Ethereum losing momentum below $2,000 | Source: ETHUSDT chart on TradingView

Technically, the breakdown shifts momentum back in favor of sellers. ETH is now trading below the short-term moving averages, while the 100-day moving average continues acting as dynamic resistance overhead near the $2,150 region. More importantly, the rejection from the major resistance zone between $2,250 and $2,350 confirmed that bulls lacked the strength necessary to reclaim the broader macro trend.

The structure has also started forming lower highs after the May peak, a classic sign of weakening demand during recovery attempts. The recent decline accelerated once ETH lost the 50-day moving average, triggering another wave of selling pressure that pushed the price back toward the lower demand zone highlighted near $1,800–$1,850.

As long as Ethereum remains below the $2,050–$2,100 region, the market structure continues to favor downside risk and prolonged consolidation rather than immediate bullish continuation.

Featured image from ChatGPT, chart from TradingView.com 

Editorial Process for bitcoinist is centered on delivering thoroughly researched, accurate, and unbiased content. We uphold strict sourcing standards, and each page undergoes diligent review by our team of top technology experts and seasoned editors. This process ensures the integrity, relevance, and value of our content for our readers.


Source link

Share76Tweet47

Related Posts

Shiba Inu Traders Withdraw 204 Billion SHIB Amid Sharp Drop In Futures Activity

Shiba Inu Traders Withdraw 204 Billion SHIB Amid Sharp Drop In Futures Activity

by Moussa
May 29, 2026
0

Traders pulled over 204 billion SHIB tokens off exchanges in a single day, a 3.6% jump from the day before,...

Bitcoin Miners Face AI Squeeze As Hash Rate Flattens And Network Enters New Security Phase, Fidelity Says

Bitcoin Miners Face AI Squeeze As Hash Rate Flattens And Network Enters New Security Phase, Fidelity Says

by Moussa
May 29, 2026
0

Digital asset markets are slogging through a choppy 2026, with prices under pressure even as the underlying plumbing of the...

BIS Tests Tokenized Bank Payments With Visa, JPMorgan, UBS and Deutsche Bank

BIS Tests Tokenized Bank Payments With Visa, JPMorgan, UBS and Deutsche Bank

by Moussa
May 28, 2026
0

Key TakeawaysBIS Project Agorá will test real-money blockchain payments with JPMorgan and UBS.ECB, Fed, and BIS aim to cut cross-border...

How do Bitcoin mining pools typically handle payout frequency versus thresholds?

bitcoin core – how does node validate scriptSig

by Moussa
May 28, 2026
0

Let's say I sent some BTC to Bob, so I created a transaction (forget about scriptPubKey) since let's say I...

Congressman Keith Self Moves To Block US CBDC Via Defense Bill Amendment

SEC Crypto: US Agency Hits Pause on Tokenized Stocks Plan

by Moussa
May 28, 2026
0

The SEC has pulled back on releasing an ‘innovation exemption’ framework that would have given regulated crypto platforms a legal...

Load More

youssufi.com

sephina.com

[vc_row full_width="stretch_row" parallax="content-moving" vc_row_background="" background_repeat="no-repeat" background_position="center center" footer_scheme="dark" css=".vc_custom_1517813231908{padding-top: 60px !important;padding-bottom: 30px !important;background-color: #191818 !important;background-position: center;background-repeat: no-repeat !important;background-size: cover !important;}" footer_widget_title_color="#fcbf46" footer_button_bg="#fcb11e"][vc_column width="1/4"]

We bring you the latest in Crypto News

[/vc_column][vc_column width="1/4"][vc_wp_categories]
[/vc_column][vc_column width="1/4"][vc_wp_tagcloud taxonomy="post_tag"][/vc_column][vc_column width="1/4"]

Newsletter

[vc_raw_html]JTNDcCUzRSUzQ2RpdiUyMGNsYXNzJTNEJTIydG5wJTIwdG5wLXN1YnNjcmlwdGlvbiUyMiUzRSUwQSUzQ2Zvcm0lMjBtZXRob2QlM0QlMjJwb3N0JTIyJTIwYWN0aW9uJTNEJTIyaHR0cHMlM0ElMkYlMkZhcHByb3gub3JnJTJGJTNGbmElM0RzJTIyJTNFJTBBJTBBJTNDaW5wdXQlMjB0eXBlJTNEJTIyaGlkZGVuJTIyJTIwbmFtZSUzRCUyMm5sYW5nJTIyJTIwdmFsdWUlM0QlMjIlMjIlM0UlM0NkaXYlMjBjbGFzcyUzRCUyMnRucC1maWVsZCUyMHRucC1maWVsZC1maXJzdG5hbWUlMjIlM0UlM0NsYWJlbCUyMGZvciUzRCUyMnRucC0xJTIyJTNFRmlyc3QlMjBuYW1lJTIwb3IlMjBmdWxsJTIwbmFtZSUzQyUyRmxhYmVsJTNFJTBBJTNDaW5wdXQlMjBjbGFzcyUzRCUyMnRucC1uYW1lJTIyJTIwdHlwZSUzRCUyMnRleHQlMjIlMjBuYW1lJTNEJTIybm4lMjIlMjBpZCUzRCUyMnRucC0xJTIyJTIwdmFsdWUlM0QlMjIlMjIlM0UlM0MlMkZkaXYlM0UlMEElM0NkaXYlMjBjbGFzcyUzRCUyMnRucC1maWVsZCUyMHRucC1maWVsZC1lbWFpbCUyMiUzRSUzQ2xhYmVsJTIwZm9yJTNEJTIydG5wLTIlMjIlM0VFbWFpbCUzQyUyRmxhYmVsJTNFJTBBJTNDaW5wdXQlMjBjbGFzcyUzRCUyMnRucC1lbWFpbCUyMiUyMHR5cGUlM0QlMjJlbWFpbCUyMiUyMG5hbWUlM0QlMjJuZSUyMiUyMGlkJTNEJTIydG5wLTIlMjIlMjB2YWx1ZSUzRCUyMiUyMiUyMHJlcXVpcmVkJTNFJTNDJTJGZGl2JTNFJTBBJTNDZGl2JTIwY2xhc3MlM0QlMjJ0bnAtZmllbGQlMjB0bnAtcHJpdmFjeS1maWVsZCUyMiUzRSUzQ2xhYmVsJTNFJTNDaW5wdXQlMjB0eXBlJTNEJTIyY2hlY2tib3glMjIlMjBuYW1lJTNEJTIybnklMjIlMjByZXF1aXJlZCUyMGNsYXNzJTNEJTIydG5wLXByaXZhY3klMjIlM0UlQzIlQTBCeSUyMGNvbnRpbnVpbmclMkMlMjB5b3UlMjBhY2NlcHQlMjB0aGUlMjBwcml2YWN5JTIwcG9saWN5JTNDJTJGbGFiZWwlM0UlM0MlMkZkaXYlM0UlM0NkaXYlMjBjbGFzcyUzRCUyMnRucC1maWVsZCUyMHRucC1maWVsZC1idXR0b24lMjIlM0UlM0NpbnB1dCUyMGNsYXNzJTNEJTIydG5wLXN1Ym1pdCUyMiUyMHR5cGUlM0QlMjJzdWJtaXQlMjIlMjB2YWx1ZSUzRCUyMlN1YnNjcmliZSUyMiUyMCUzRSUwQSUzQyUyRmRpdiUzRSUwQSUzQyUyRmZvcm0lM0UlMEElM0MlMkZkaXYlM0UlM0NiciUyRiUzRSUzQyUyRnAlM0U=[/vc_raw_html][/vc_column][/vc_row]
No Result
View All Result
  • Contact Us
  • Homepages
  • Business
  • Guide

© 2024 APPROX FOUNDATION - The Crypto Currency News