
Bitcoin (BTC) is trading at $76,350, which is above several key investors’ cost-basis levels. The one-to-three-month holder average sits at $75,620, placing a large share of recent buyers near breakeven, while the price sits just below the US spot exchange-traded fund (ETF) cost basis of $76,700.
The short-term holder (STH) cost basis and the adjusted realized price extend on either side of this range, increasing the importance of the $75,000 level as a near-term support pivot.
BTC cost basis cluster tightens near $75,000
The one-to three-month holder cohorts share an average cost basis of $75,620. That level capped the price earlier in March when BTC fell to $62,000 from $75,600 in two weeks, but now it aligns as a potential support pivot.
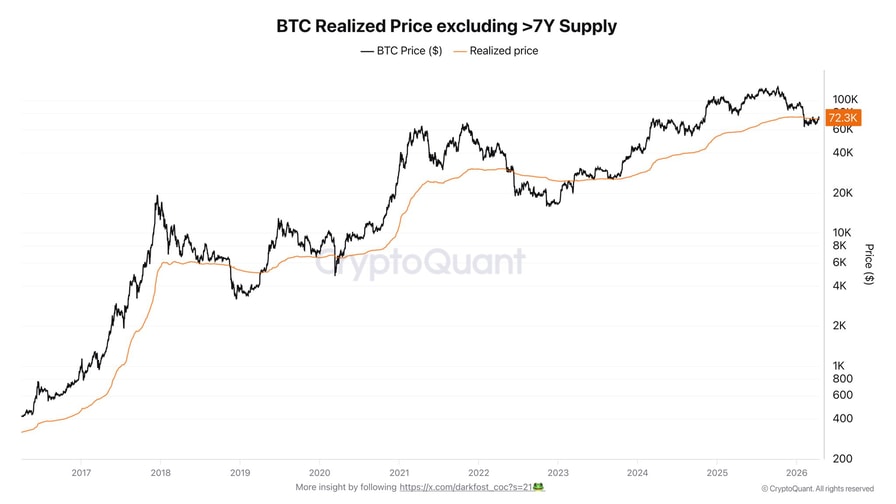
BTC realized price excluding more than a seven-year supply. Source: CryptoQuant
Bitcoin has also closed above the adjusted realized price at $72,300. This metric tracks the average acquisition cost of circulating supply, excluding coins held for more than seven years. A move above it places a large share of investors above the break-even level.
Crypto analyst Darkfost noted that a weekly close above the adjusted realized price on April 19 signaled stronger long-term investor conviction in Bitcoin. The analyst added,
“A truly bullish signal would be for Bitcoin to start building a standard deviation above this average cost basis, pushing more investors into profit and encouraging them to hold due to increased conviction.”
US spot ETF positioning adds an institutional cost basis level. The weighted average cost basis of US spot Bitcoin ETFs sits near $76,700, placing the price close to a key area of recent institutional accumulation. The short-term holder’s cost basis is near $81,800, a level at which investors could build more conviction if the price holds above it.
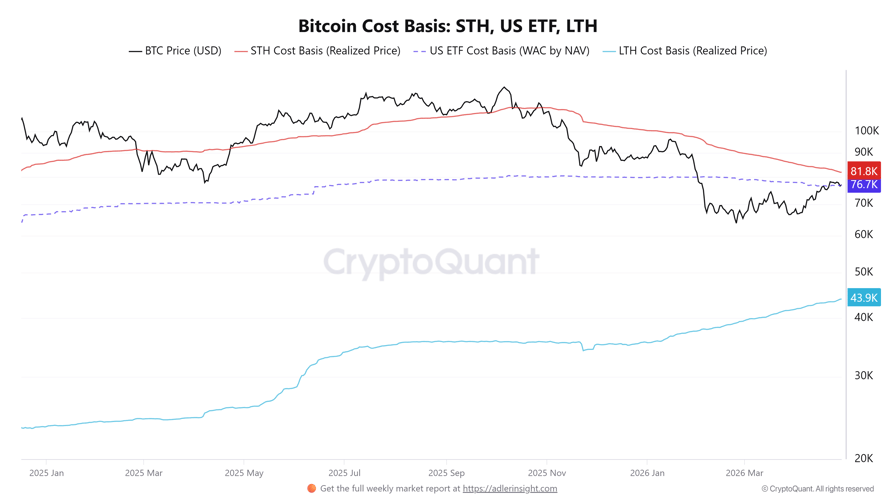
Bitcoin cost basis for STH, US ETF, and LTH. Source: CryptoQuant
Together, these overlapping cost bases compress around $75,000, concentrating both realized and unrealized positioning in a narrow price range. This clustering increases price sensitivity to flows near this level, making it a key support zone.
Related: Bitcoin eyes $75K after ‘most hawkish’ FOMC as oil hits highest since 2022
BTC liquidity bands outline the near-term range
With the support level established at $75,000, the derivatives data outlines a tight liquidity corridor. Cumulative long liquidation risk nears $74,000, with roughly $2.69 billion at risk, while short liquidations near $80,000 total about $4.48 billion.
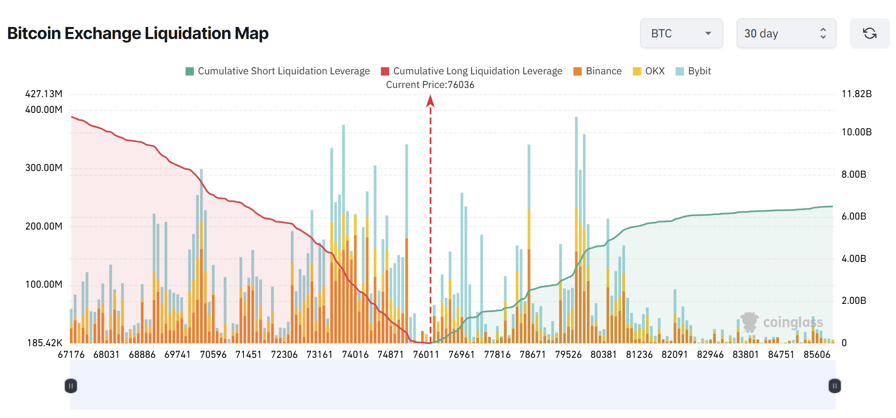
Bitcoin exchange liquidation map. Source: CoinGlass
A recent swing between $77,873 and $74,868 on Wednesday cleared $494 million in positions, including $347 million in longs.
Crypto analyst CW said the high-leverage longs have been reduced, while a larger pool of short liquidations sits above $80,000. The $74,000 to $80,000 band continues to anchor positioning, with both sides clustering around key cost-basis levels.
Related: Most crypto investors believe Bitcoin is undervalued: Coinbase survey